


DATA INTERPRETATION (BAR GRAPH)
1➤
Direction (Qs.1-6): In the following bar diagram the number of engineers employed in various companies has been given. Study the bar diagram carefully to answer the questions.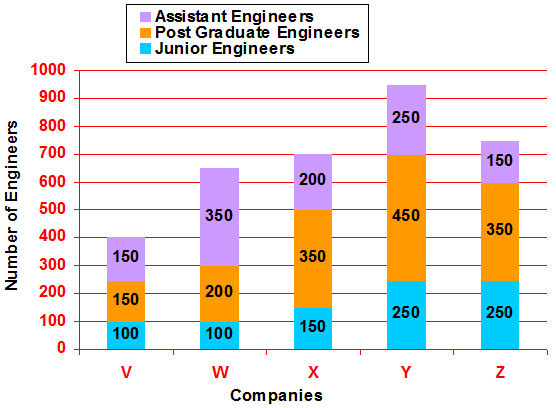
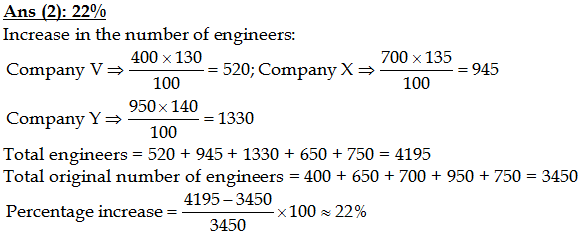
Q.If the number of all the engineers in the company V, Company X and Company Y be increased by 30%, 35% and 40% respectively, what will be the overall percentage increase in the number of all engineers of all the companies taken together?
(1) 20%
(2) 22%
(3) 24%
(4) 25%
(5) None of these
2➤ What is the ratio between the number of assistant engineers employed in company V and company X?
(1) 3 : 5
(2) 3 : 4
(3) 2 : 3
(4) 3 : 2
(5) None of these
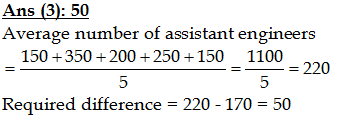
3➤ What is the average number of junior engineers employed in all the companies?
(1) 150
(2) 170
(3) 160
(4) 180
(5) 190
4➤ What is the average number of junior engineers employed in all the companies?
(1) 150
(2) 170
(3) 160
(4) 180
(5) 190
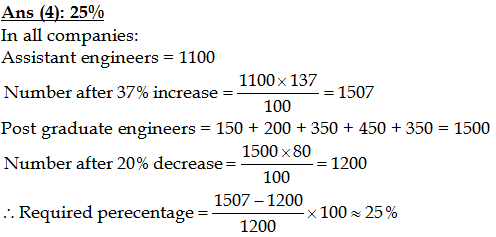
5➤ If the number of assistant engineers employed in all the companies be increased by 37% and the number of post graduate engineers employed in all the companies be decreased by 20%, by what percent will the number of assistant engineers be more than that of post graduate engineers?
(1) 32%
(2) 27%
(3) 22%
(4) 25%
(5) None of these
6➤ If the number of assistant engineers employed in all the companies be increased by 37% and the number of post graduate engineers employed in all the companies be decreased by 20%, by what percent will the number of assistant engineers be more than that of post graduate engineers?
(1) 32%
(2) 27%
(3) 22%
(4) 25%
(5) None of these
Read Our Article on Bar Graph DI Questions Set-3
