


PIE CHART
Direction (Qs.1-5): The following pie chart shows the percentage distribution of the expenditure incurred by Mr. Arpit of his yearly salary on various aspects.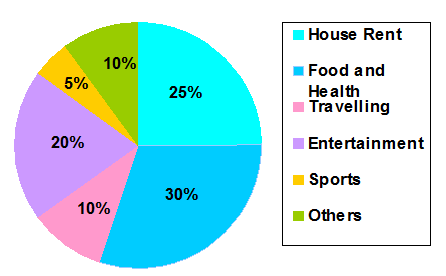
1➤ What is the ratio of average expenditure on travelling, sports & others to average expenditure on house rent & entertainment?
(1) 9 : 4
(2) 4 : 9
(3) 5 : 9
(4) 10 : 27
(5) None of these

2➤ If House rent paid by Mr.Arpit is Rs.12500. What would be the difference between the expenditure on Entertainment & sports?
(1) Rs.7500
(2) Rs.8000
(3) Rs.10000
(4) Rs.9000
(5) None of these

3➤ Which of the two expenditures together have a central angle 72°?
(1) Travelling & Others
(2) Travelling & House rent
(3) Entertainment & others
(4) Food and Health & sports
(5) None of these

4➤ If expenditure on Food & Health is Rs.66870, what will be the expenditure on others?
(1) Rs.22280
(2) Rs.23490
(3) Rs.22290
(4) Rs.21590
(5) None of these

5➤ If expenditure on Travelling amounts to Rs.96000, then what will be expenditure on sports?
(1) Rs.48000
(2) Rs.42000
(3) Rs.64000
(4) Rs.72000
(5) None of these

Read Our Article on Blood Relation DI Questions Set-1
